Best Neighborhoods For Buyers & Sellers
Updated Apr 5, 2026
What does this mean for you?
Text or call 713-425-4194
Best For Buyers
| Neighborhood | Median Sale Price | Median Sales Price 5 Year Change |
|---|---|---|
| Washington East/Sabine | $568,000 | 24% |
| Northside | $249,945 | 8% |
| Knollwood/Woodside | $550,000 | 24% |
| Northwest Houston | $280,000 | 17% |
| Oak Forest West | $372,450 | 12% |
| Spring Branch | $444,590 | 18% |
| Five Corners | $260,750 | 21% |
| Medical Center South | $247,500 | 14% |
| Denver Harbor | $295,000 | 4% |
| Westchase Area | $850,000 | 17% |
| Neighborhood | Median Sale Price | Median Sales Price 5 Year Change |
|---|---|---|
| Waller | $281,167 | -1% |
| Hockley | $299,990 | 13% |
| Brookshire | $294,990 | 31% |
| Fulshear/South Brookshire | $391,995 | 3% |
| Crosby Area | $260,000 | 2% |
| Huffman Area | $275,120 | 14% |
| Tomball Southwest | $455,200 | 10% |
| Conroe Southwest | $304,423 | -3% |
| Magnolia/1488 West | $324,848 | 10% |
| Conroe Northeast | $259,995 | 4% |
Best For Sellers
| Neighborhood | Median Sale Price | Median Sales Price 5 Year Change |
|---|---|---|
| River Oaks Shopping Area | $890,000 | 15% |
| West University/Southside Area | $1,837,500 | 31% |
| River Oaks Area | $2,950,000 | 24% |
| Garden Oaks | $845,499 | 35% |
| Bellaire Area | $1,255,000 | 33% |
| Memorial Villages | $2,492,000 | 48% |
| Rice / Museum District | $1,151,000 | 31% |
| Shepherd Park Plaza Area | $450,000 | 28% |
| Briarmeadow/Tanglewilde | $407,500 | 16% |
| Tanglewood Area | $1,750,000 | 1% |
| Neighborhood | Median Sale Price | Median Sales Price 5 Year Change |
|---|---|---|
| Sugar Land East | $473,500 | 31% |
| Sugar Land North | $327,000 | 9% |
| Sugar Land South | $627,833 | 28% |
| Memorial West | $750,000 | 53% |
| 1960/Cypress | $289,500 | 15% |
| Fall Creek Area | $455,000 | 19% |
| Eldridge North | $382,400 | 13% |
| Kingwood South | $354,500 | 13% |
| Bacliff/San Leon | $240,000 | 2% |
| Santa Fe | $350,000 | 18% |
Sources & Methodology
The data is for Houston (Data from the HAR MLS for purchases of single family homes over $125,000, not at lot value, in MLS Areas 1, 2, 3, 4, 5, 6, 7, 8, 9, 10, 11, 12, 13, 14, 15, 16, 17, 18, 19, 20, 21, 22, 23, 24, 25, 26, 28, 29, 30, 31, 32, 33, 34, 35, 36, 37, 38, 39, 40, 55 & 57).
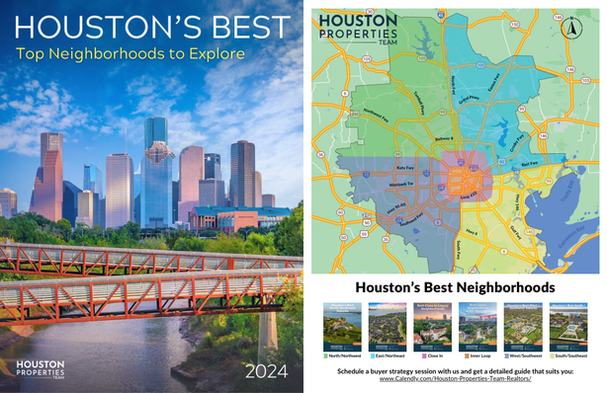
As explained in our Best Houston Neighborhoods Guide, since Houston is over 600 square miles, we have segmented the city into six quadrants: Inner Loop, Close In (But Not Inner Loop), North/Northwest, East/Northeast, West / Southwest, South / Southeast.
We grouped Inner Loop & Close In regions into the “Central Houston” category.
We grouped North/Northwest, East/Northeast, West / Southwest, South / Southeast regions into the “Houston Suburbs” category.
Then, we analyzed every Houston MLS Geo Market Area (aka Houston Neighborhood) that has over 10 active listings and compared the total number of properties with price reductions to the total number of active listings.
Houston Neighborhoods with the highest percentage of properties with a price reduction are on the “Best For Buyers” list. Houston Neighborhoods with the lowest percentage of properties with a price reduction are on the “Best For Sellers” list.